Saturday, September 8, 2012

Normal MRS


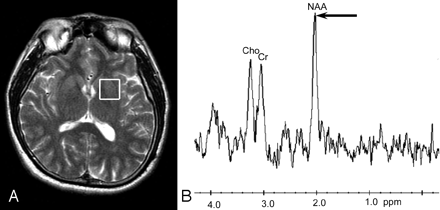
In vivo MR spectroscopy of normal brain. Axial T2-weighted MR image shows a single voxel of interest for MR spectroscopy (white box) placed within the brain parenchyma in a healthy volunteer (A). The corresponding in vivo MR spectrum shows the normal dominant peaks of NAA at 2.0 ppm (arrow), Cr at 3.0 ppm, and Cho at 3.2 ppm (B).
Normal MR spectra obtained from gray matter and white matter are shown on the right. The predominant metabolites, displayed from right to left, are NAA, creatine, choline, and myo-inositol. The primary difference between the two spectra is that gray matter has more creatine.Hunter's angle is the line formed by the metabolites on the white matter spectrum. The common way to analyze clinical spectra is to look at metabolite ratios, namely NAA/Cr, NAA/Cho, and Cho/Cr. Normal and abnormal values are shown in the chart to the right. By including a known reference solution when acquiring the MR spectral data, absolute concentrations of metabolites can be calculated.


No comments:

Post a Comment